by teaton | Jan 7, 2019 | Updates
Infographics make it easy to understand the facts and figures of the local recovery efforts throughout Texas following Hurricane Harvey.
The Federal Emergency Management Agency (FEMA) has compiled, created, and regularly updated infographics during the recovery process that have provided information such as the assistance provided so far, the number of survivors in temporary housing, innovative repair programs, and more.
With the one-year anniversary of Hurricane Harvey approaching, FEMA has published an additional set of infographics that goes into more depth about the first year of the recovery process. The information in it is accurate as of August 17, 2018.
FEMA also released their latest statewide figures, which were updated on August 20, 2018. Additionally, they released county-by-county information – as well as the city-specific information for Houston, Port Aransas, and Rockport – that is current as of August 17, 2018.
You can view or download the one-year infographics, as well as the latest recovery infographics for the state, for all counties, and for three specific cities affected by Hurricane Harvey below.
Statewide as of January 07, 2019:
Download (PDF, 1.77MB)
Download (PDF, 643KB)
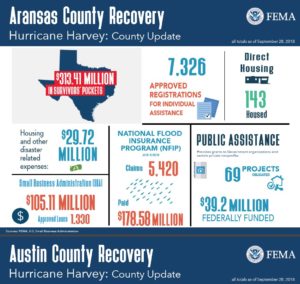
Cites and counties as of January 4, 2019::
Download (PDF, 1.77MB)
by teaton | Nov 6, 2018 | Updates
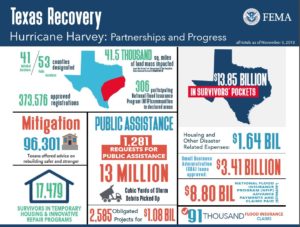 Infographics make it easy to understand the facts and figures of the local recovery efforts throughout Texas following Hurricane Harvey.
The Federal Emergency Management Agency (FEMA) has compiled, created, and regularly updated infographics during the recovery process that have provided information such as the assistance provided so far, the number of survivors in temporary housing, innovative repair programs, and more.
With the one-year anniversary of Hurricane Harvey approaching, FEMA has published an additional set of infographics that goes into more depth about the first year of the recovery process. The information in it is accurate as of August 17, 2018.
FEMA also released their latest statewide figures, which were updated on August 20, 2018. Additionally, they released county-by-county information – as well as the city-specific information for Houston, Port Aransas, and Rockport – that is current as of August 17, 2018.
You can view or download the one-year infographics, as well as the latest recovery infographics for the state, for all counties, and for three specific cities affected by Hurricane Harvey below.
Statewide as of Nov. 5, 2018:
Download (PDF, 218KB)
Cites and counties as of Nov. 5, 2018:
Download (PDF, 4.89MB)
by teaton | Oct 12, 2018 | Updates
 Infographics make it easy to understand the facts and figures of the local recovery efforts throughout Texas following Hurricane Harvey.
The Federal Emergency Management Agency (FEMA) has compiled, created, and regularly updated infographics during the recovery process that have provided information such as the assistance provided so far, the number of survivors in temporary housing, innovative repair programs, and more.
With the one-year anniversary of Hurricane Harvey approaching, FEMA has published an additional set of infographics that goes into more depth about the first year of the recovery process. The information in it is accurate as of August 17, 2018.
FEMA also released their latest statewide figures, which were updated on August 20, 2018. Additionally, they released county-by-county information – as well as the city-specific information for Houston, Port Aransas, and Rockport – that is current as of August 17, 2018.
You can view or download the one-year infographics, as well as the latest recovery infographics for the state, for all counties, and for three specific cities affected by Hurricane Harvey below.
Statewide as of Oct. 1, 2018:
Download (PDF, 1.02MB)
Counties and Select Cities as of Oct. 1:
Download (PDF, 4.86MB)
by teaton | Jun 6, 2018 | Updates
 Commissioner of Education Mike Morath announced Wednesday that campuses, school districts and open-enrollment charter schools directly affected by Hurricane Harvey will be eligible for special evaluation in this year’s state accountability system, if they meet a specific criterion.
Under the Hurricane Harvey Provision, 2018 accountability ratings will be generated for eligible districts, charter schools and campuses using available data, such as:
- If a campus meeting at least one of the Hurricane Harvey criteria receives an “Improvement Required” rating, the campus will be labeled “Not Rated.”
- If a district or open-enrollment charter school meeting at least one of the Hurricane Harvey criteria receives a B, C, D, or F rating, the district or open-enrollment charter school will be labeled “Not Rated.” (As part of House Bill 22, districts will receive a rating of A, B, C, D or F in 2018.)
The established criteria are based on data reported by districts and charter schools to the Texas Education Agency over the past school year. The data reported indicates the number of displaced students and teachers, as well as the impact on local school facilities and instructional time. Districts and charters were given several opportunities to submit information regarding students, teachers and facilities throughout the school year.
Campuses will be evaluated under the Hurricane Harvey Provision if they meet at least one of the following criteria:
- The campus identified 10 percent or more of enrolled students with specific crisis codes for displaced or homeless students. Campus enrollment is based on October snapshot data; OR
- The campus reported 10 percent or more of its teachers experienced homelessness due to Hurricane Harvey (as reported in a Homeless Survey announced Feb. 14, 2018); OR
- The campus was reported to TEA as closed for 10 or more instructional days due to Hurricane Harvey; OR
- The campus was reported to TEA as displaced due to Hurricane Harvey either because the student population was relocated to another geographic location (at least through winter break) or the student population was required to share its own campus facility with the students of another campus closed as a direct result of Hurricane Harvey (at least through winter break).
This represents a substantial expansion to storm-related accountability adjustments when compared to prior storms in Texas. For example, Hurricane Ike in 2008 resulted in accountability adjustments for campuses based only on one of the above criteria – whether a campus was closed 10 or more days.
School districts and open-enrollment charter schools will be labeled “Not Rated” if all campuses within the school district or open-enrollment charter school receive a “Not Rated” label as a result of the Hurricane Harvey Provision. Additionally, if 10 percent or more of the school district or open-enrollment charter school’s students were enrolled in a campus labeled “Not Rated” under the Hurricane Harvey Provision, the school district or open-enrollment charter school will be labeled “Not Rated.”
For purposes of counting consecutive years of ratings, 2017 and 2019 will be considered consecutive for school districts, open-enrollment charter schools and campuses receiving a “Not Rated” label in 2018 due to hurricane-related issues.
Any hurricane-affected school district, open-enrollment charter school, or campus not identified as eligible for this provision may appeal under the accountability appeals process.
The Hurricane Harvey Provision will be part of an administrative rule-making process to adopt the 2018 Accountability Manual. The provision was formally posted on the Texas Register website and available for public comment on June 5. It is also available on the TEA website during the public comment period. To view a PDF copy of the Hurricane Harvey Provision, visit https://tea.texas.gov/2018accountabilitymanual.aspx.
by teaton | May 7, 2018 | Updates
 Infographics make it easy to understand the facts and figures of the local recovery efforts throughout Texas following Hurricane Harvey.
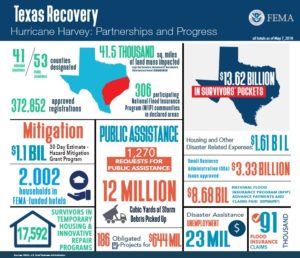
These infographics were compiled, created, and updated by the Federal Emergency Management Agency (FEMA). They include information about the assistance provided so far, the number of survivors currently in temporary housing and innovative repair programs, and more.
The statewide figures were updated on May 7, 2018, and the county-by-county information is current as of May 4, 2018. Both will continue to be updated throughout the recovery process.
You can view or download the latest recovery infographics for the state and for all counties affected by Hurricane Harvey below.
Statewide:
Download (PDF, 13.03MB)
County-by-County:
Download (PDF, 4.11MB)