
 Infographics make it easy to understand the facts and figures of the local recovery efforts throughout Texas following Hurricane Harvey.
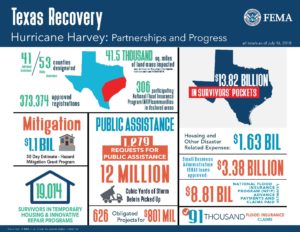
These infographics were compiled, created, and updated by the Federal Emergency Management Agency (FEMA). They include information about the assistance provided so far, the number of survivors currently in temporary housing and innovative repair programs, and more.
The statewide figures were updated on July 16, 2018, and the county-by-county information – as well as the city-specific information for Houston, Port Aransas, and Rockport – is current as of July 13, 2018. All infographics will continue to be updated throughout the recovery process.
You can view or download the latest recovery infographics for the state, for all counties, and for three specific cities affected by Hurricane Harvey below.
Statewide:
Counties and Select Cities: