by rhamilton | Jul 23, 2018 | Updates
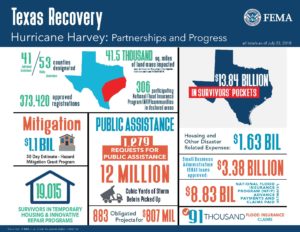 Infographics make it easy to understand the facts and figures of the local recovery efforts throughout Texas following Hurricane Harvey.
These infographics were compiled, created, and updated by the Federal Emergency Management Agency (FEMA). They include information about the assistance provided so far, the number of survivors currently in temporary housing and innovative repair programs, and more.
The statewide figures were updated on July 23, 2018, and the county-by-county information – as well as the city-specific information for Houston, Port Aransas, and Rockport – is current as of July 20, 2018. All infographics will continue to be updated throughout the recovery process.
You can view or download the latest recovery infographics for the state, for all counties, and for three specific cities affected by Hurricane Harvey below.
Statewide:
Download (PDF, 207KB)
Counties and Select Cities:
Download (PDF, 4.82MB)
by rhamilton | Jul 18, 2018 | Updates
 Infographics make it easy to understand the facts and figures of the local recovery efforts throughout Texas following Hurricane Harvey.
These infographics were compiled, created, and updated by the Federal Emergency Management Agency (FEMA). They include information about the assistance provided so far, the number of survivors currently in temporary housing and innovative repair programs, and more.
The statewide figures were updated on July 16, 2018, and the county-by-county information – as well as the city-specific information for Houston, Port Aransas, and Rockport – is current as of July 13, 2018. All infographics will continue to be updated throughout the recovery process.
You can view or download the latest recovery infographics for the state, for all counties, and for three specific cities affected by Hurricane Harvey below.
Statewide:
Download (PDF, 207KB)
Counties and Select Cities:
Download (PDF, 4.8MB)
by rhamilton | Jul 13, 2018 | Updates
 “In a year that saw the state of Texas challenged by Hurricane Harvey — with its economic impact felt across the Coastal Bend region and beyond — it is a testament to the resilience of the people of Texas and the diversity of our economy to be named America’s Top State for Business by CNBC, the Best State for Startups by WalletHub, and again the Best State for Business by CEOs surveyed by Chief Executive magazine. Today, Texas leads all states in private-sector job creation, with over 346,300 private-sector jobs added over the last year. New business formation in Texas is at a five-year high, and jobs in Texas are now on pace for the strongest growth in four years. While recovery continues for our families, businesses and communities, it is because of the hardworking people of Texas that the future is so bright in the Lone Star State. ”
─ Governor Greg Abbott
Governor’s Commission to Rebuild Texas
- The U.S. Army Corps of Engineers (USACE) announced nearly $5 billion in disaster recovery funding for critical flood mitigation projects, including a number of high-priority projects identified by Governor Abbott and local leaders. This allocation is in addition to the $500 million announced by the USACE last month.
- Governor Abbott announced that Texas has been named America’s Top State for Business by CNBC, noting in the Corpus Christi Caller-Times that “the future looks bright in our coastal communities. While businesses are still recovering from Hurricane Harvey, tourists are returning, retail sales are trending up and real estate sales are rebounding… business conditions are improving and business leaders are optimistic.”
- To promote local economies and support the 169,000 jobs directly created by travel spending in the 20 Texas Gulf Coast counties, the Governor’s Economic Development and Tourism division’s Travel Texas program has been running travel ads throughout the U.S., generating an estimated 200 million impressions through TV, digital display ads and paid social media. A targeted digital campaign promoting the Texas coast as open for business ran April through June, generating an additional 21 million impressions. Travel Texas also posted a “Texplorer” social media video promotion highlighting Rockport-Fulton, Port Aransas, Mustang Island, Padre Island and Corpus Christi. Along with these and other advertising investments, Travel Texas funded a satellite media tour — a series of TV, radio and online interviews ─ focused on Gulf Coast travel, garnering over 19 million impressions.
- Hurricane season runs through November. Governor Abbott reminds Texans to review their property’s flood risk and current insurance coverage, and to consider whether a separate flood policy should be part of their home protection plan. Most flood policies have a 30-day waiting period before taking effect. Visit FloodSmart.gov to find more information.
- Because of daily outreach, 6,573 reports have been submitted from the field to the Assistance Center at Texas A&M. From those reports, the Assistance Center identified 749 issues needed follow-up or resolution, and all but two have been resolved as of July 12.
Housing
Individual Assistance
- Current individual assistance numbers are now posted on rebuildtexas.today/recovery-tracker.
- To find the nearest Disaster Recovery Center visit fema.gov/drc, or text DRC along with a zip code to 43362 (4FEMA). Survivors also can find help by calling FEMA at 800-621-3362, logging into DisasterAssistance.gov or downloading the FEMA app fema.gov/mobile-app.
- FEMA’s Disaster Distress Helpline offers trained professionals who can help callers cope with anxiety or stress, and guide them to available resources. This toll-free, multilingual and confidential crisis support service is open 24 hours a day, seven days a week. Call 800-985-5990, 800-846-8517 (TTY) or text TalkWithUs (Spanish-speakers text: Hablanos) to 66746.

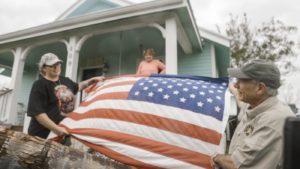
As seen in “Special Report: Texas Coastal Comeback” from Texas Highways: Elena Rodriguez, curator of the Rockport Center of the Arts, stands #RockportStrong in the sculpture garden at the Center’s 130-year-old, Harvey-damaged and now-razed building. With its relocation to Navigation Circle and a $500,000 grant from the Rebuild Texas Fund, the Center is once again a must-see tourist destination with a full schedule of exhibitions underway. (Photo courtesy: Texas Highways)
by rhamilton | Jul 9, 2018 | Updates
 Infographics make it easy to understand the facts and figures of the local recovery efforts throughout Texas following Hurricane Harvey.
These infographics were compiled, created, and updated by the Federal Emergency Management Agency (FEMA). They include information about the assistance provided so far, the number of survivors currently in temporary housing and innovative repair programs, and more.
The statewide figures were updated on July 9, 2018, and the county-by-county information – as well as the city-specific information for Houston, Port Aransas, and Rockport – is current as of July 6, 2018. All infographics will continue to be updated throughout the recovery process.
You can view or download the latest recovery infographics for the state, for all counties, and for three specific cities affected by Hurricane Harvey below.
Statewide:
Download (PDF, 206KB)
Counties and Select Cities:
Download (PDF, 4.82MB)
by rhamilton | Jul 2, 2018 | Updates
 Infographics make it easy to understand the facts and figures of the local recovery efforts throughout Texas following Hurricane Harvey.
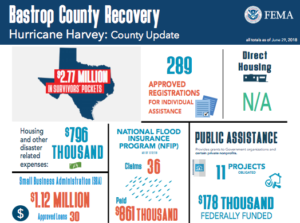
These infographics were compiled, created, and updated by the Federal Emergency Management Agency (FEMA). They include information about the assistance provided so far, the number of survivors currently in temporary housing and innovative repair programs, and more.
The statewide figures were updated on July 2, 2018, and the county-by-county information – as well as the city-specific information for Houston, Port Aransas, and Rockport – is current as of June 29, 2018. All infographics will continue to be updated throughout the recovery process.
You can view or download the latest recovery infographics for the state, for all counties, and for three specific cities affected by Hurricane Harvey below.
Statewide:
Download (PDF, 3.13MB)
Counties and Select Cities:
Download (PDF, 4.76MB)